


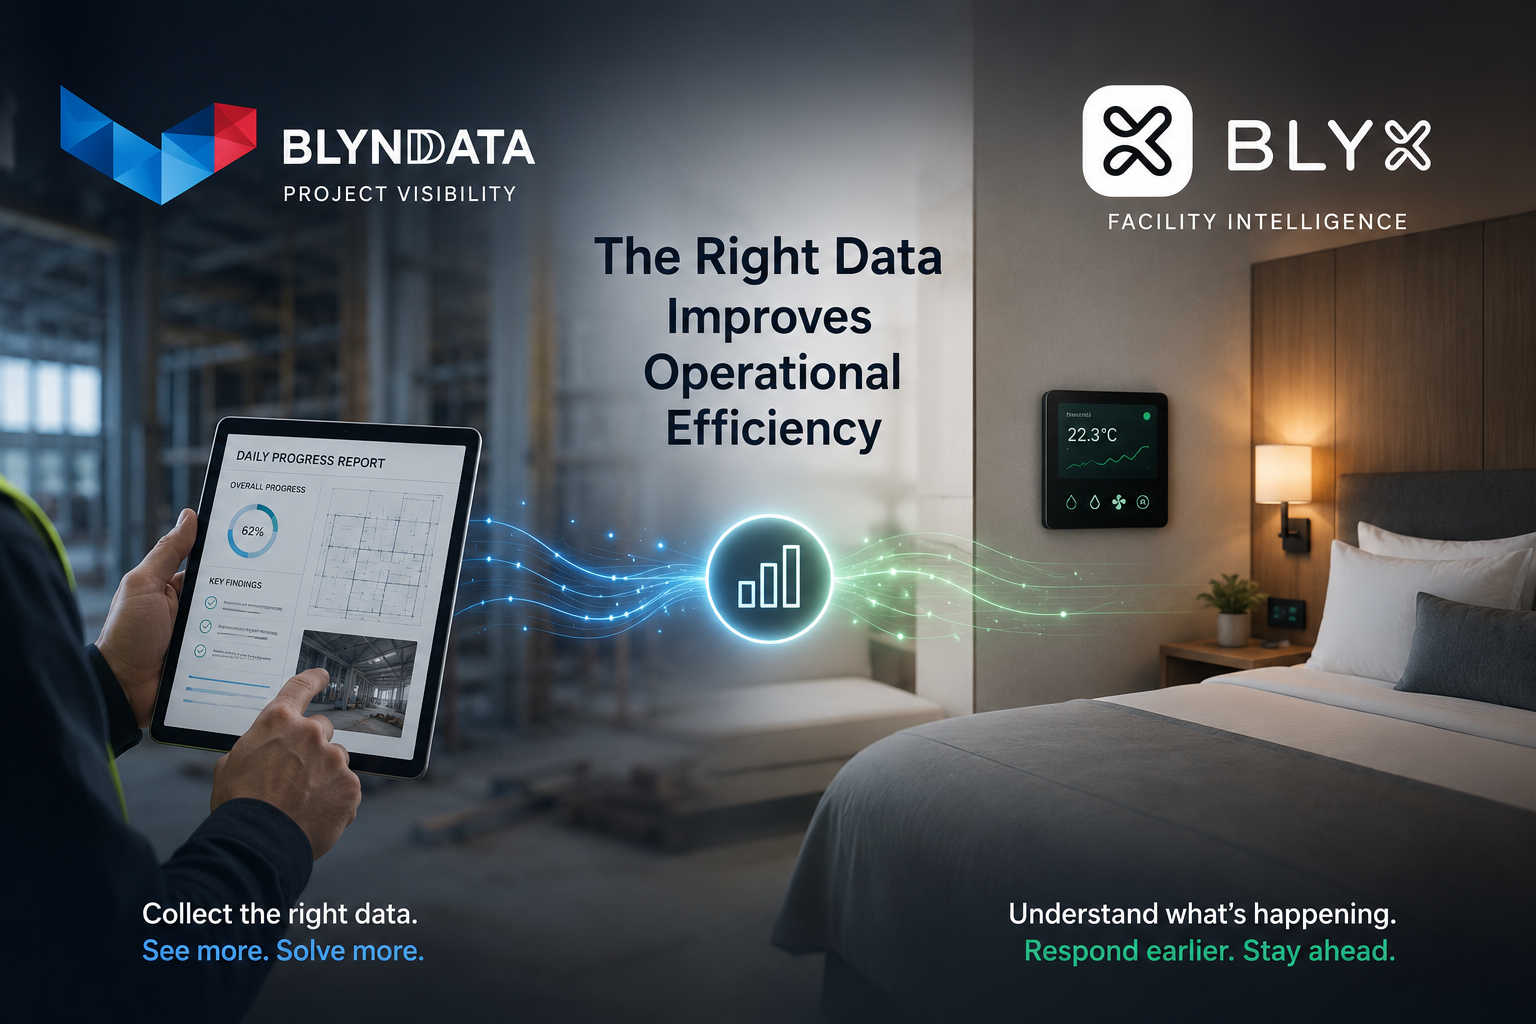
Better Data Creates Better Decisions
Most operational problems are not caused by people doing the wrong thing.
More often than not, they happen because the right information is either missing, delayed, isolated, or difficult to see clearly. Small gaps in visibility create inefficiencies that compound over time.
At Blynd Data, we spend a lot of time looking at how businesses operate day to day and identifying where small changes to data collection and workflows can create very different outcomes. Sometimes the impact can be much bigger than expected.
Small Process Changes
A good example of this is refurbishment or renovation projects in remote locations.
Often a crew is brought in to complete demolition or strip-out works before the next stage of renovations begins. The challenge is that there is usually a gap between demolition being completed and the next scope of work being properly planned, approved or ready to start.
In hot and remote environments, productivity also naturally drops as fatigue builds across a swing — especially when teams are pushed through extreme heat conditions all day.
Sometimes the better outcome is not pushing harder. It is changing the process slightly.
Instead of having the crew continue physical demolition work through the hottest parts of the day, a portion of that time could be redirected into collecting structured room-condition and dilapidation data.
Using very simple tick-box style reporting forms, crews can quickly capture the condition of rooms, identify missing or damaged items, and flag issues that will impact the next stage of works. The structured tick-box format also removes a lot of the confusion that comes with handwritten reports — there is less back and forward trying to interpret handwriting, clarify notes or confirm what was actually reported. The completed reports can then simply be scanned or photographed at the end of the day and sent to an offshore support team to process into a live master database and reporting system.
This creates several advantages at the same time:
- the crew maintains productive output throughout the day
- physical fatigue and heat stress are reduced
- the client gains daily visibility of project progress
- future material requirements and work scopes become easier to forecast
- planning for the next stages of work can begin earlier
Most importantly, the data starts creating transparency around what is really happening on the project.
Rather than waiting until the end of a stage to understand issues, bottlenecks or opportunities, the information becomes visible in real time. That visibility allows both the client and contractor to make faster and more effective decisions.
Visibility Changes Outcomes
Every day, the client could see:
- how many rooms had been completed
- what condition issues were appearing most frequently
- what materials would likely need ordering
- where future bottlenecks may occur
- how renovation planning should be adjusted
The reporting then evolved into tracking installation progress as the project moved into renovation stages. The same team completed simple completion cards daily, which were processed into the same master database.
The result was not just better reporting.
The result was operational transparency.
The client could see progress clearly. Decisions could be made earlier. Planning became proactive rather than reactive.
Most importantly, the crew were able to demonstrate ongoing value because they could clearly show both completed work and the future pipeline of work still required.
What was initially expected to be a six-week project ultimately extended to fifteen weeks.
Not because of more labour.
Because of better visibility.
The Blynd Data Approach
This is really what Blynd Data is about.
Helping businesses collect, structure and process the right information so local teams can operate more efficiently and focus on the higher-value work that drives outcomes.
The goal is not simply “more data.”
The goal is useful data presented in a way that helps people make faster and better decisions.
Sometimes the biggest operational improvements come from very small workflow changes.
How This Relates to Blyx
Blyx was developed from this same way of thinking.
Facilities already contain huge amounts of information:
- access events
- room usage
- HVAC activity
- temperature and humidity trends
- maintenance activity
- housekeeping schedules
- energy consumption
The problem is that most systems operate independently, meaning the data only tells part of the story.
Blyx connects these data points together to create operational visibility in real time.
For example:
- Blyx can trigger an AC unit before guest arrival and monitor whether the room temperature is actually responding, helping identify failing systems before a complaint is made.
- It can identify when a room is approaching check-in time but housekeeping or maintenance staff have not yet accessed the room, allowing the facility to proactively respond before the guest arrives.
- Temperature, humidity and occupancy data together can help identify conditions that may lead to mould, excessive energy use or equipment failure.
Individually, each data point is useful.
Connected together, they become operational intelligence.
At both Blynd Data and Blyx, the focus is the same:
Collect the right information.
Make it transparent.
Present it in a format people can actually use.
Because when the right data is connected properly, businesses can move from reacting to problems… to proactively managing outcomes.